Thesis research
My thesis research deals with time series analysis in situations when the times are uncertain -- this type of problem arises in the context of paleoenvironmental studies where samples are obtained as a function of depth rather than time.
The approach that I am taking is to model the amount of time it takes each sampled depth increment in a core to accumulate. Some of the core samples will have dating information, which may have a complicated distribution of possible dates. These date distributions are part of the likelihood. When modeling the amount of time it takes to accumulate a certain depth, we assume that the rates of accumulation share a common distribution, which we also estimate. The resulting age estimates appear regularised and robust to errors in dates, which are not uncommon. The age estimates are subsequently used in time series analysis of paleoenvironmental proxies.
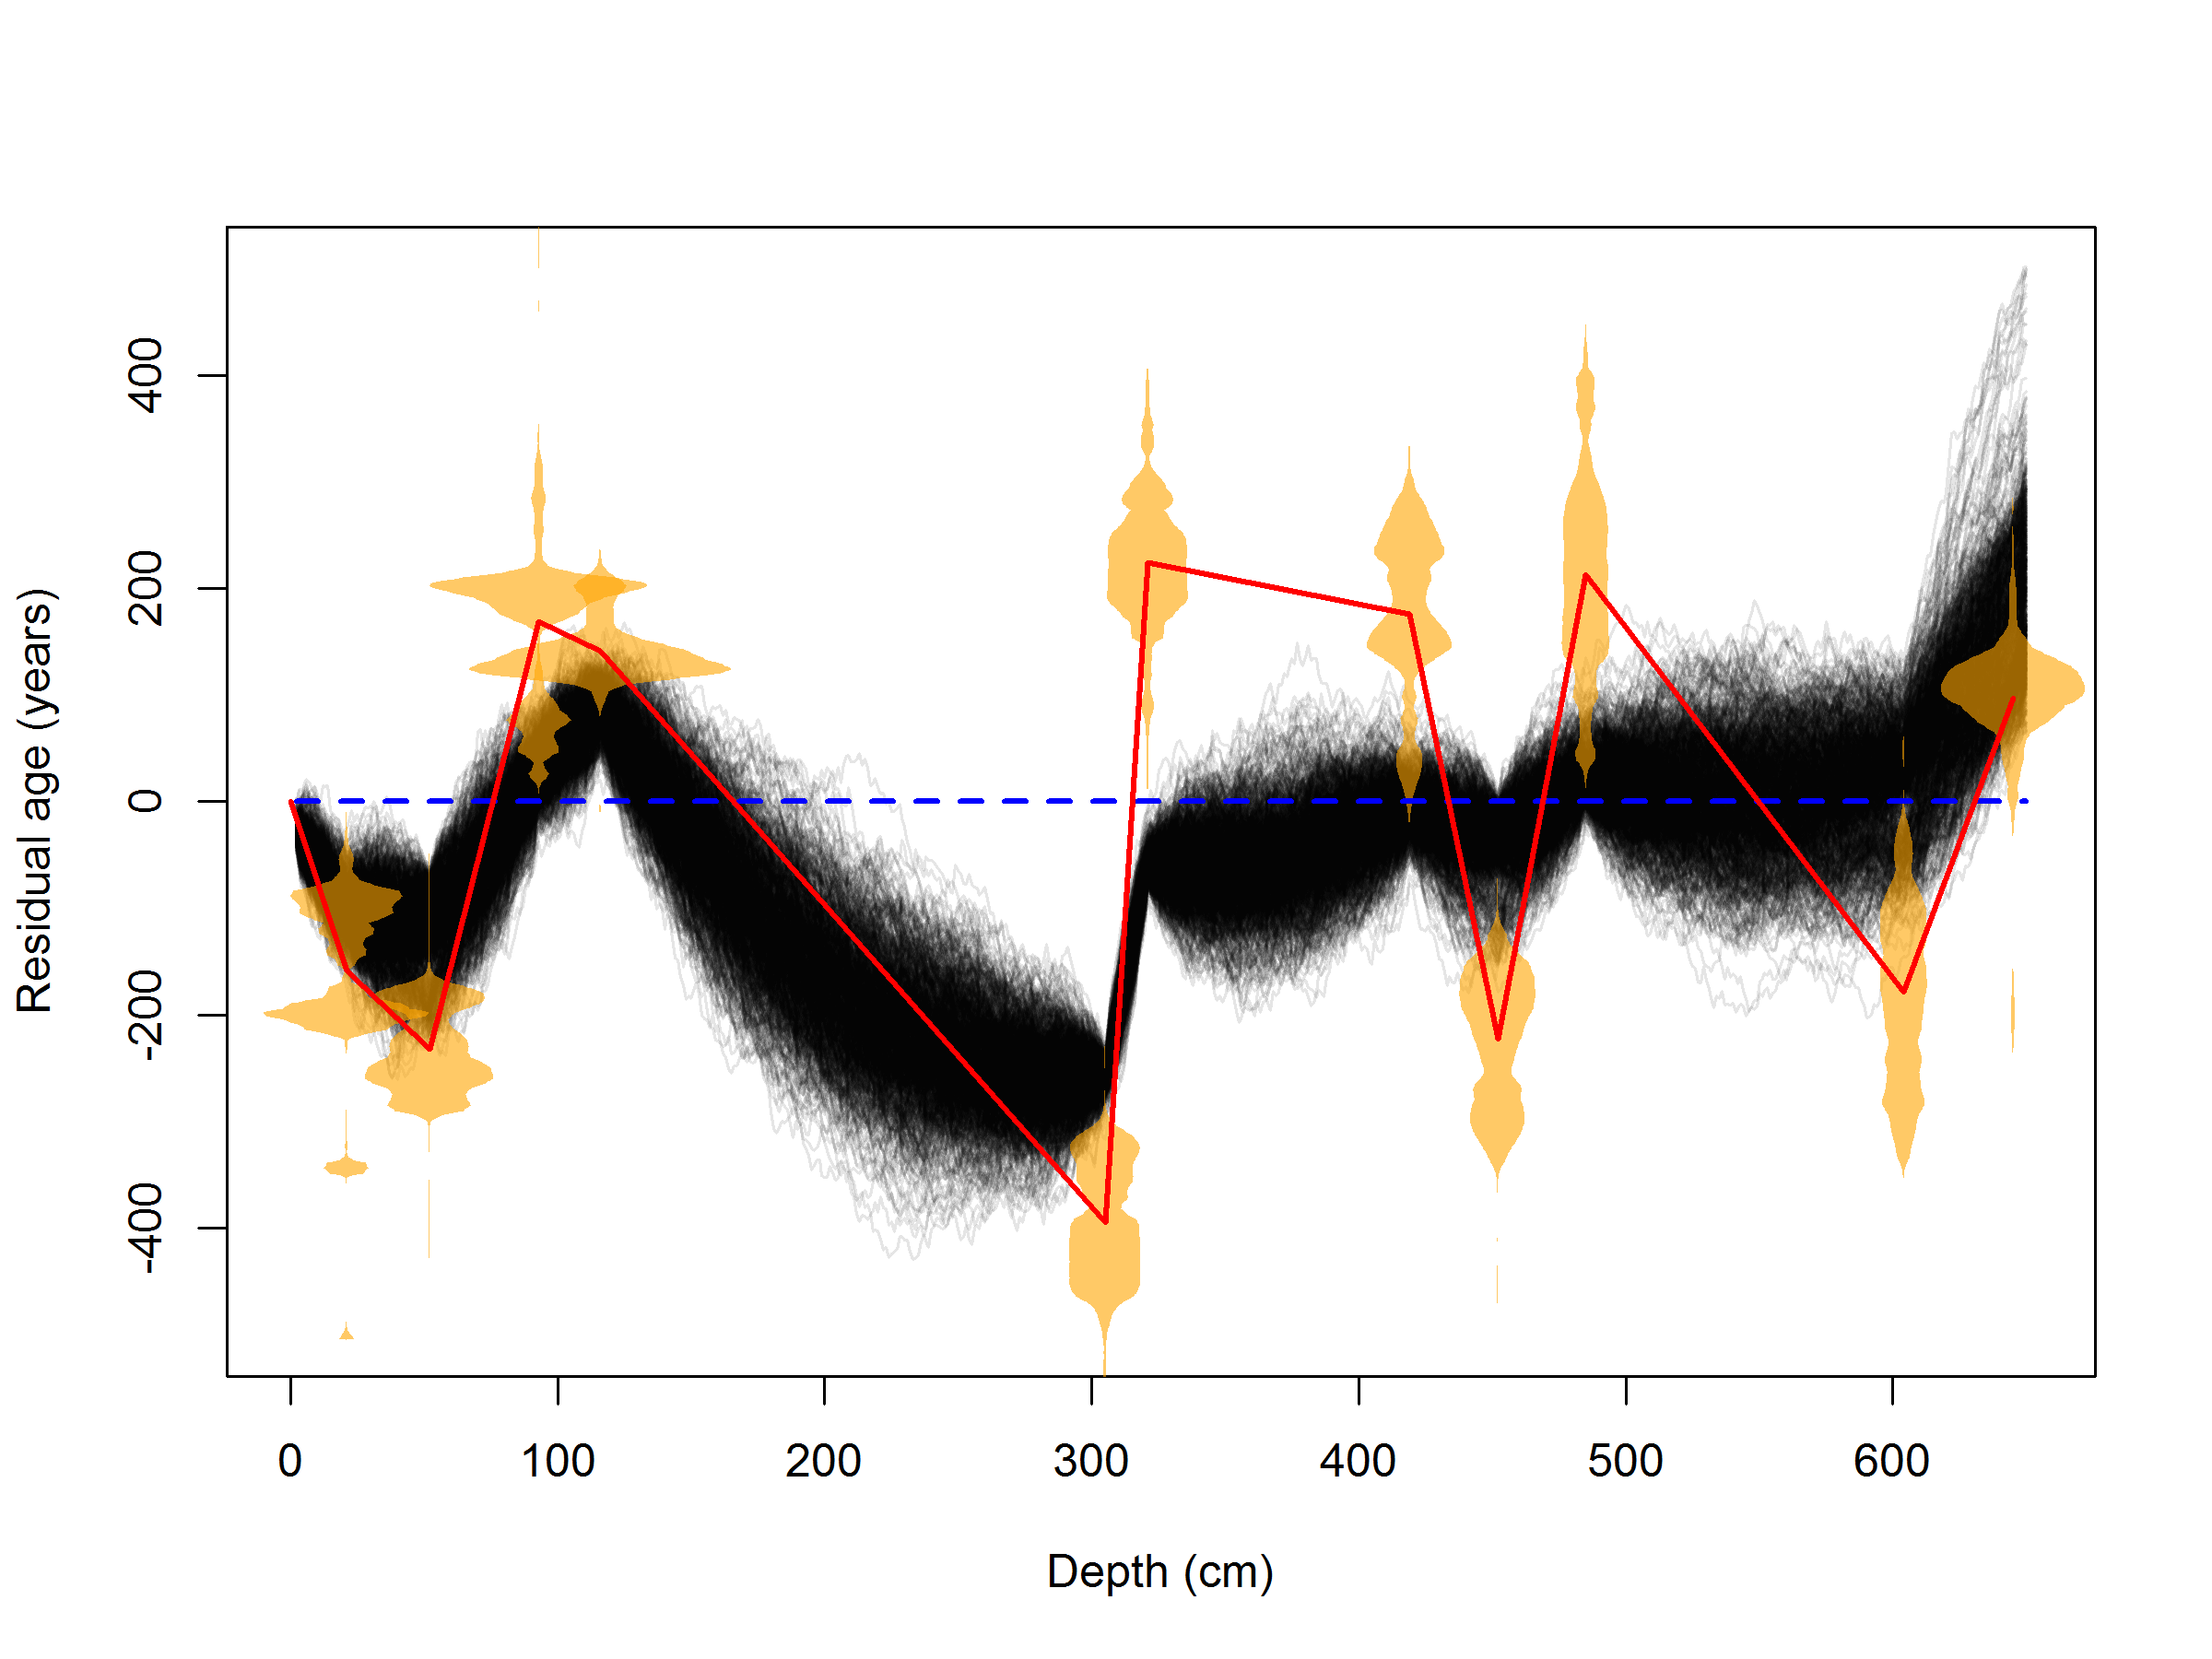 A comparison of my method to a cubic polynomial fit (blue dashed line)
and a connect-the-dots linear interpolation (red line) on a Tibetan peat core record.
Each thin black line is an equal-probability age-versus depth relationship.
My method appears to be a compromise between curve fitting and
interpolation.
A comparison of my method to a cubic polynomial fit (blue dashed line)
and a connect-the-dots linear interpolation (red line) on a Tibetan peat core record.
Each thin black line is an equal-probability age-versus depth relationship.
My method appears to be a compromise between curve fitting and
interpolation.
Please see my JSM proceedings paper for more details: Read more »
Data rescue: magnetograms
The Earth has a time-varying (geo)magnetic field that is tied to changes in the Sun-Earth system. Thus, geomagnetic measurements contain important information about the Sun and its influence on Earth. Both the geomagnetic field and solar activity vary on timescales ranging from seconds to centuries or longer. However, modern digital measurements of the geomagnetic field are limited to 40-50 years, or about four solar activity cycles. We are working with Natural Resources Canada to digitize a much longer geomagnetic record that began in the 1840s at the Toronto magnetic observatory. The magnetograms, originally recorded on photographic paper, were transferred to 35mm film in the 1980s. We are converting these film copies to digital images and using specialized methods for unsupervised extraction of the time series data contained therein. Unsupervised extraction is important for reproducibility and because there are in excess of 32,000 images totaling about 500Gb of computer storage. Following the unsupervised extraction procedure, we will be checking each magnetogram trace to ensure data quality. This is a long term project!
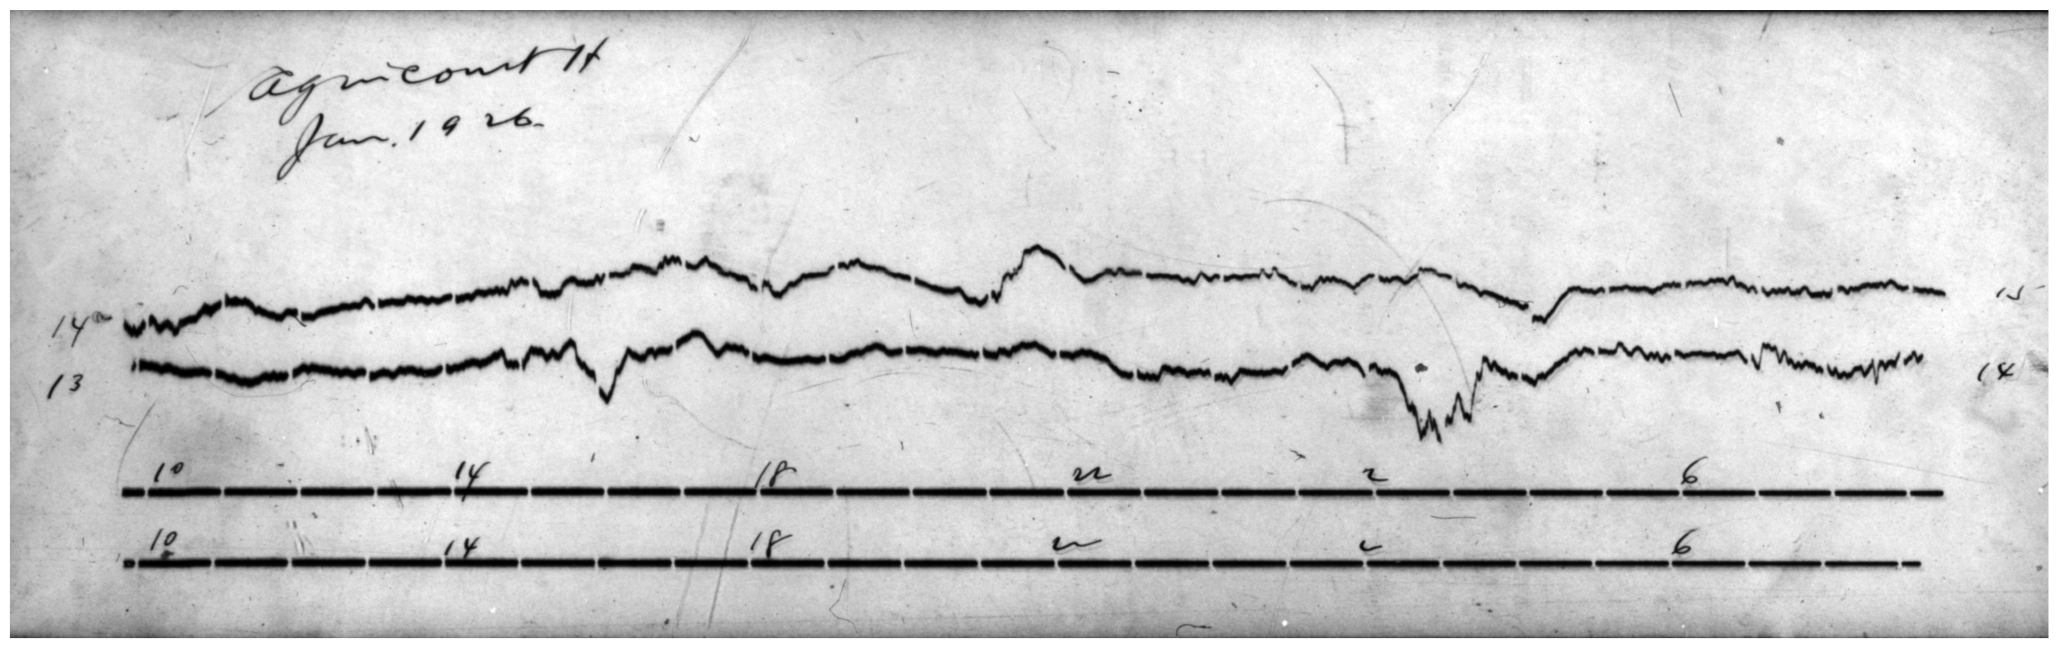 A magnetogram recorded on photographic paper at Agincourt magnetic
observatory, January 13-14, 1926.
A magnetogram recorded on photographic paper at Agincourt magnetic
observatory, January 13-14, 1926.
Check out our poster from the 2014 AGU fall meeting: Poster »
Forecasting solar activity
Solar activity can have appreciable damaging effects on Earth-based power transmission systems. Solar storms in particular cause large variations in Earth's magnetic field, inducing current in transmission lines and causing damage to sensitive power transformers and other equipment. Power companies are interested in predicting when such storms will occur in order to mitigate damages, but current forecast horizons are only on the order of days. This project took a forecasting approach based on the hypothesis that subsurface stresses initiate solar flare events, which can result in coronal mass ejections and solar storms at Earth. Our approach uses multitaper spectral estimates of solar gravity modes to forecast a cumulative solar stress index using a very simple state-space model. In retrospective analysis, this stress index was found to be correlated with variance in log X-ray data measured near Earth by GOES spacecraft. We used this index to generate forecasts of when large solar events are more likely to occur.
Please see our JSM proceedings paper for more details: Read more »
In the second stage of this project, I wanted to see if we could forecast the magnitude of large solar events over a similar timeframe. Following from our previous hypothesis,I invetigated whether there was some characteristic of solar gravity mode estimates that was indicative of the magnitude of solar proton events in the near future. I found that there were some six month periods where a power-law was not able to properly describe the distribution of gravity mode estimates. I generated an index based on this property.

I defined three forecast categories based on the index. In retrospective analysis, the forecast categories based on the index performed well when forecasting the magnitude of proton events at Earth over a six month forecast horizon (see the boxplots above).
Interpolation of ground-level ozone
Health Canada researchers are investigating what causes variation in ozone-related mortality risk in larger Canadian cities. As part of this investigation, we examined the ground-level ozone records carefully, and generated predicted ozone concentrations when none were available. The methods for short-term prediction were based on the correlation structure of the ozone time series in question. However, we found that for long-term missing ozone (on the order of days or longer), a different approach was required. The city of Halifax in particular is a challenge because there are long gaps in the city-wide record that are about a year long.
Our approach for prediction over these long gaps is to use precursor information where available. We decided to use regression trees for prediction instead of parametric modelling because they are able to capture complicated relationships and interactions between the precursors and ozone, and algorithms exist to handle missing covariate values, which are abundant. "Learning" methods such as regression trees are also desirable because they are geared for good prediction performance. Using regression trees, we were able to generate predictions that explain forty-five percent of the total variation in ozone concentration at Halifax, and seventy-two percent of the total variation in ozone concentration at Toronto. In Halifax, the variables with the most importance were other regional ozone measurements and the UV index. In Toronto, the variables with the most importance were local NOx, insolation, and temperature. We included prediction uncertainty using a bootstrap procedure by resampling within the leaves (terminal groups) of the regression tree either using the empirical distribution of the data grouped at the leaf.
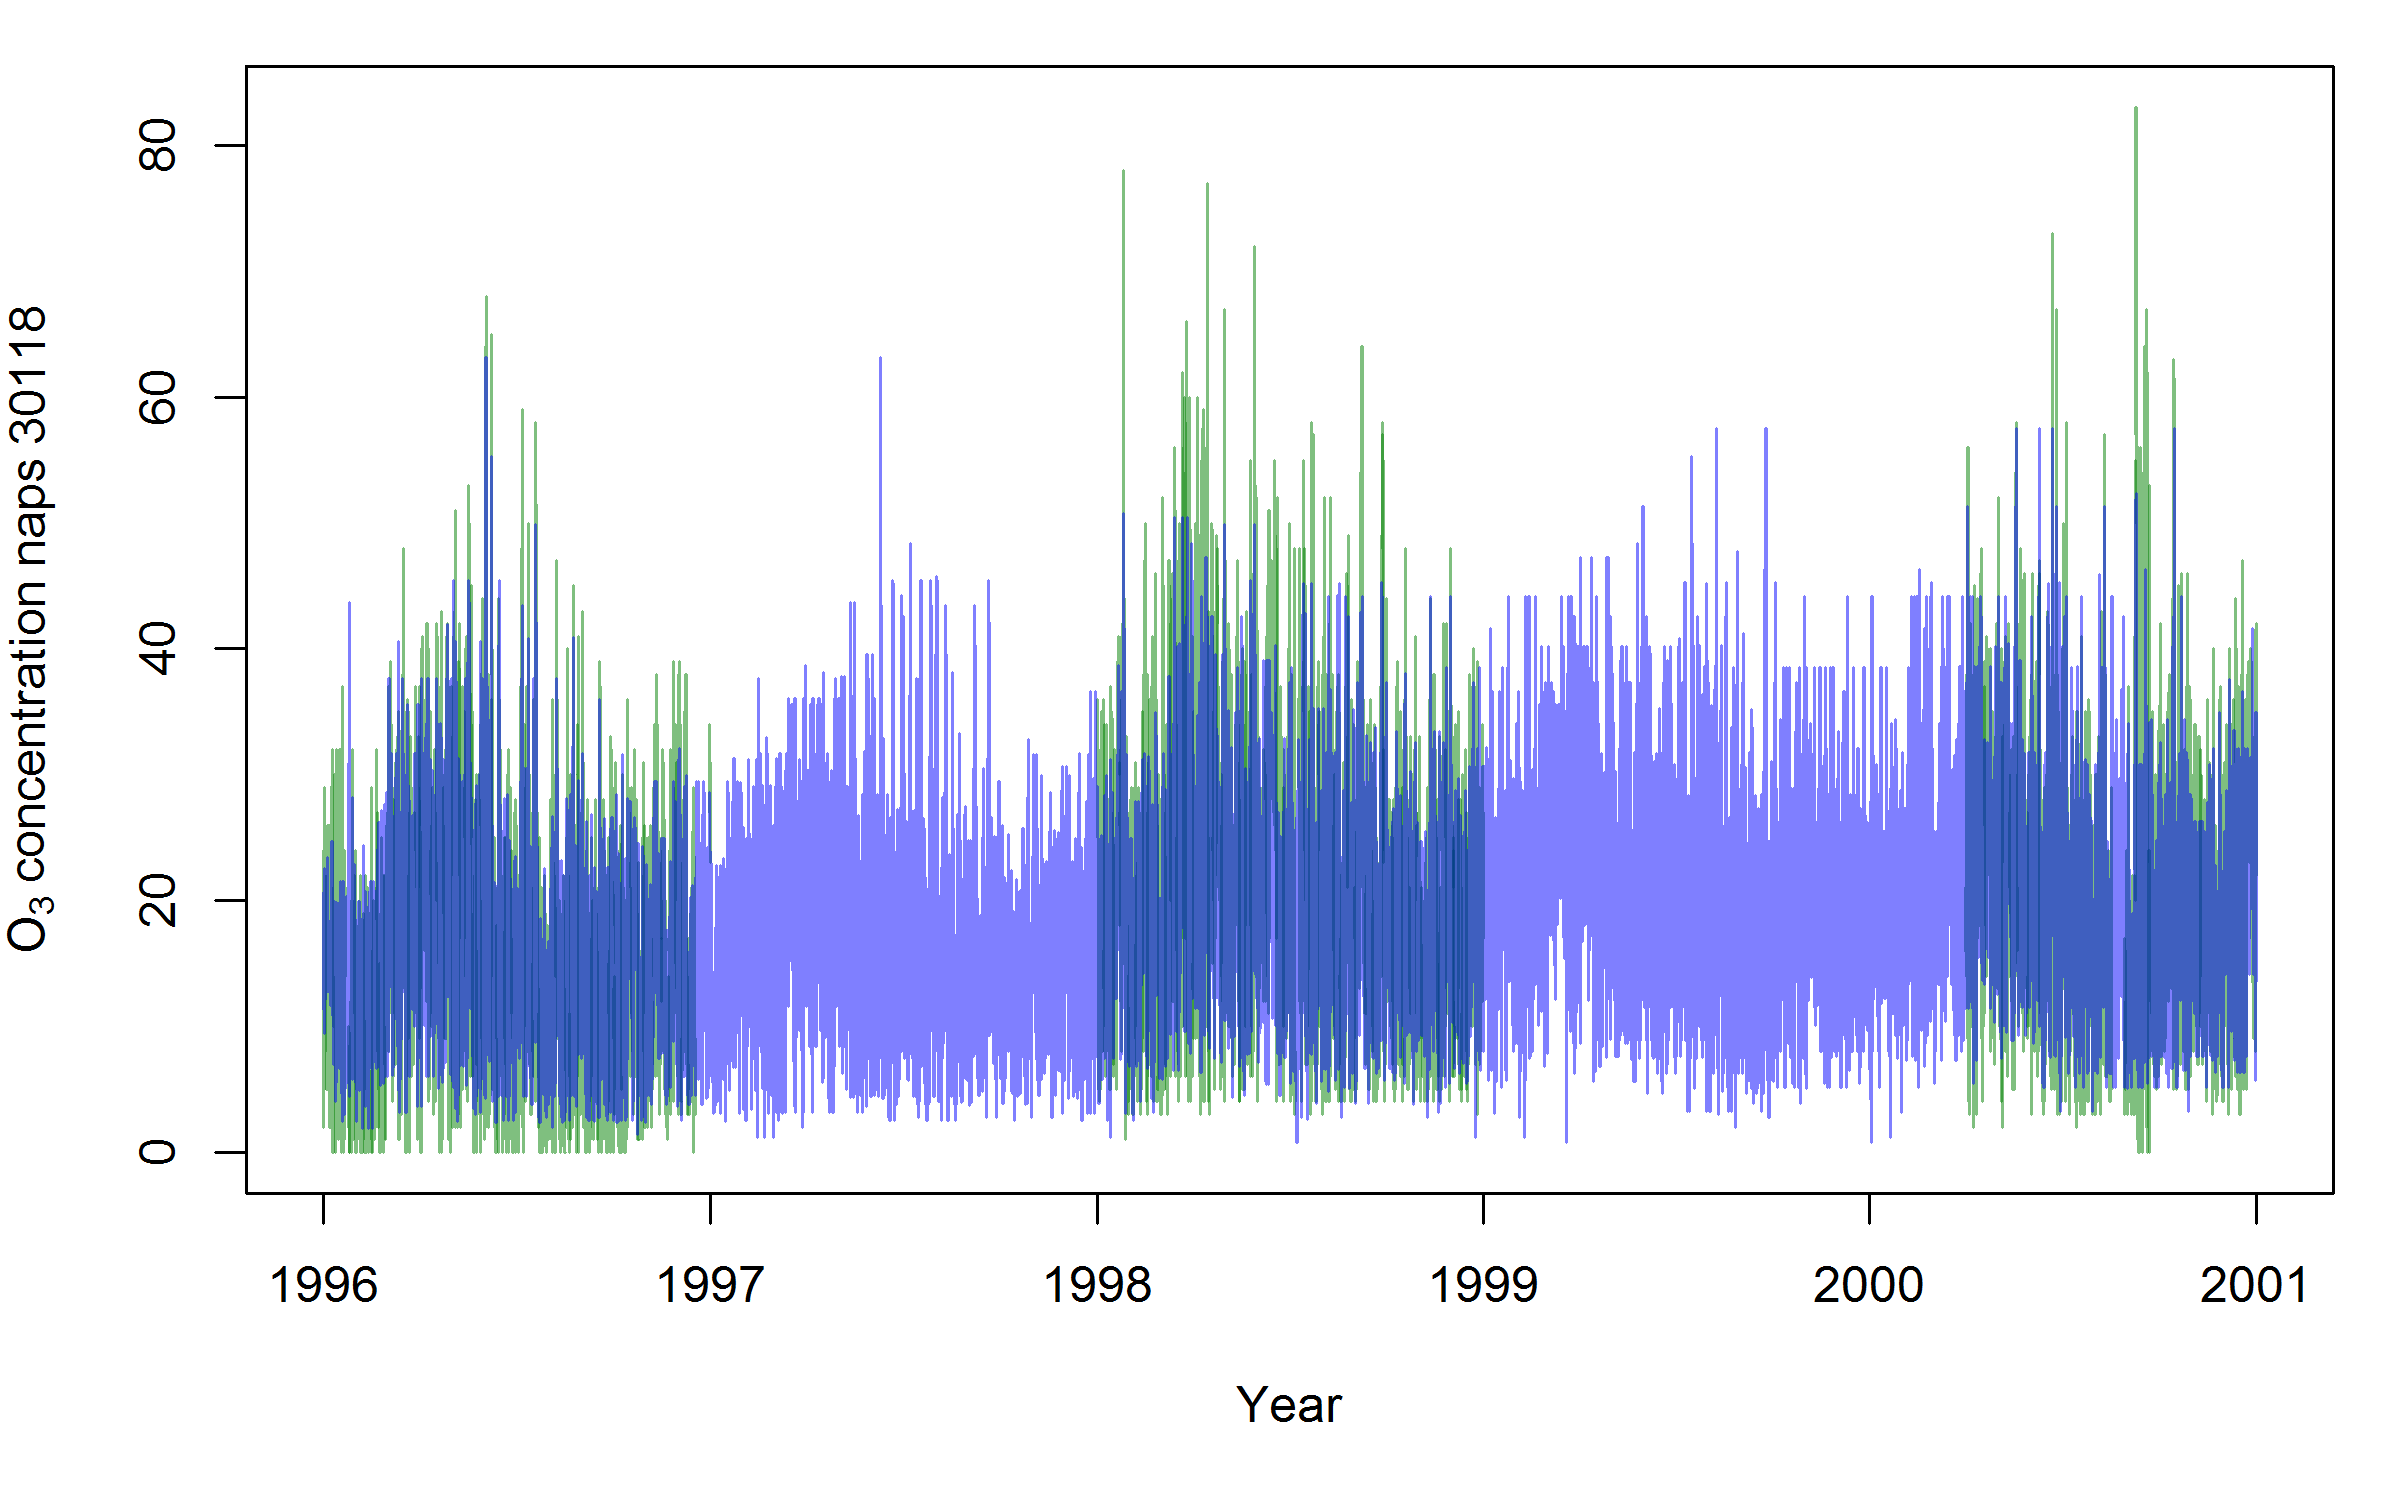 Predicted O3 concentration for station 30118 in Halifax, for years of particular interest from 1996-2001.
The prediction is plotted in light blue. The data, where available, are plotted in light green. Overlapping areas are in dark blue.
Predicted O3 concentration for station 30118 in Halifax, for years of particular interest from 1996-2001.
The prediction is plotted in light blue. The data, where available, are plotted in light green. Overlapping areas are in dark blue.
A poster describing this project was presented at the Statistical Society of Canada meetings 2016: Poster »
Spatial Catch-per-Unit-Effort Analysis
My Master's research project was a spatial analysis of British Columbia sablefish fishery catch records. Fishery catch records are often used to compute catch per unit of effort (CPUE) statistics, which are assumed to be an index of fish abundance. However, there is a decoupling of CPUE and fish abundance if fishing operations are able to target high abundance locations preferentially (e.g. Newfoundland cod stocks). By averaging CPUE over space rather than by fishing event, this type of bias can be reduced and a more representative index of abundance results.
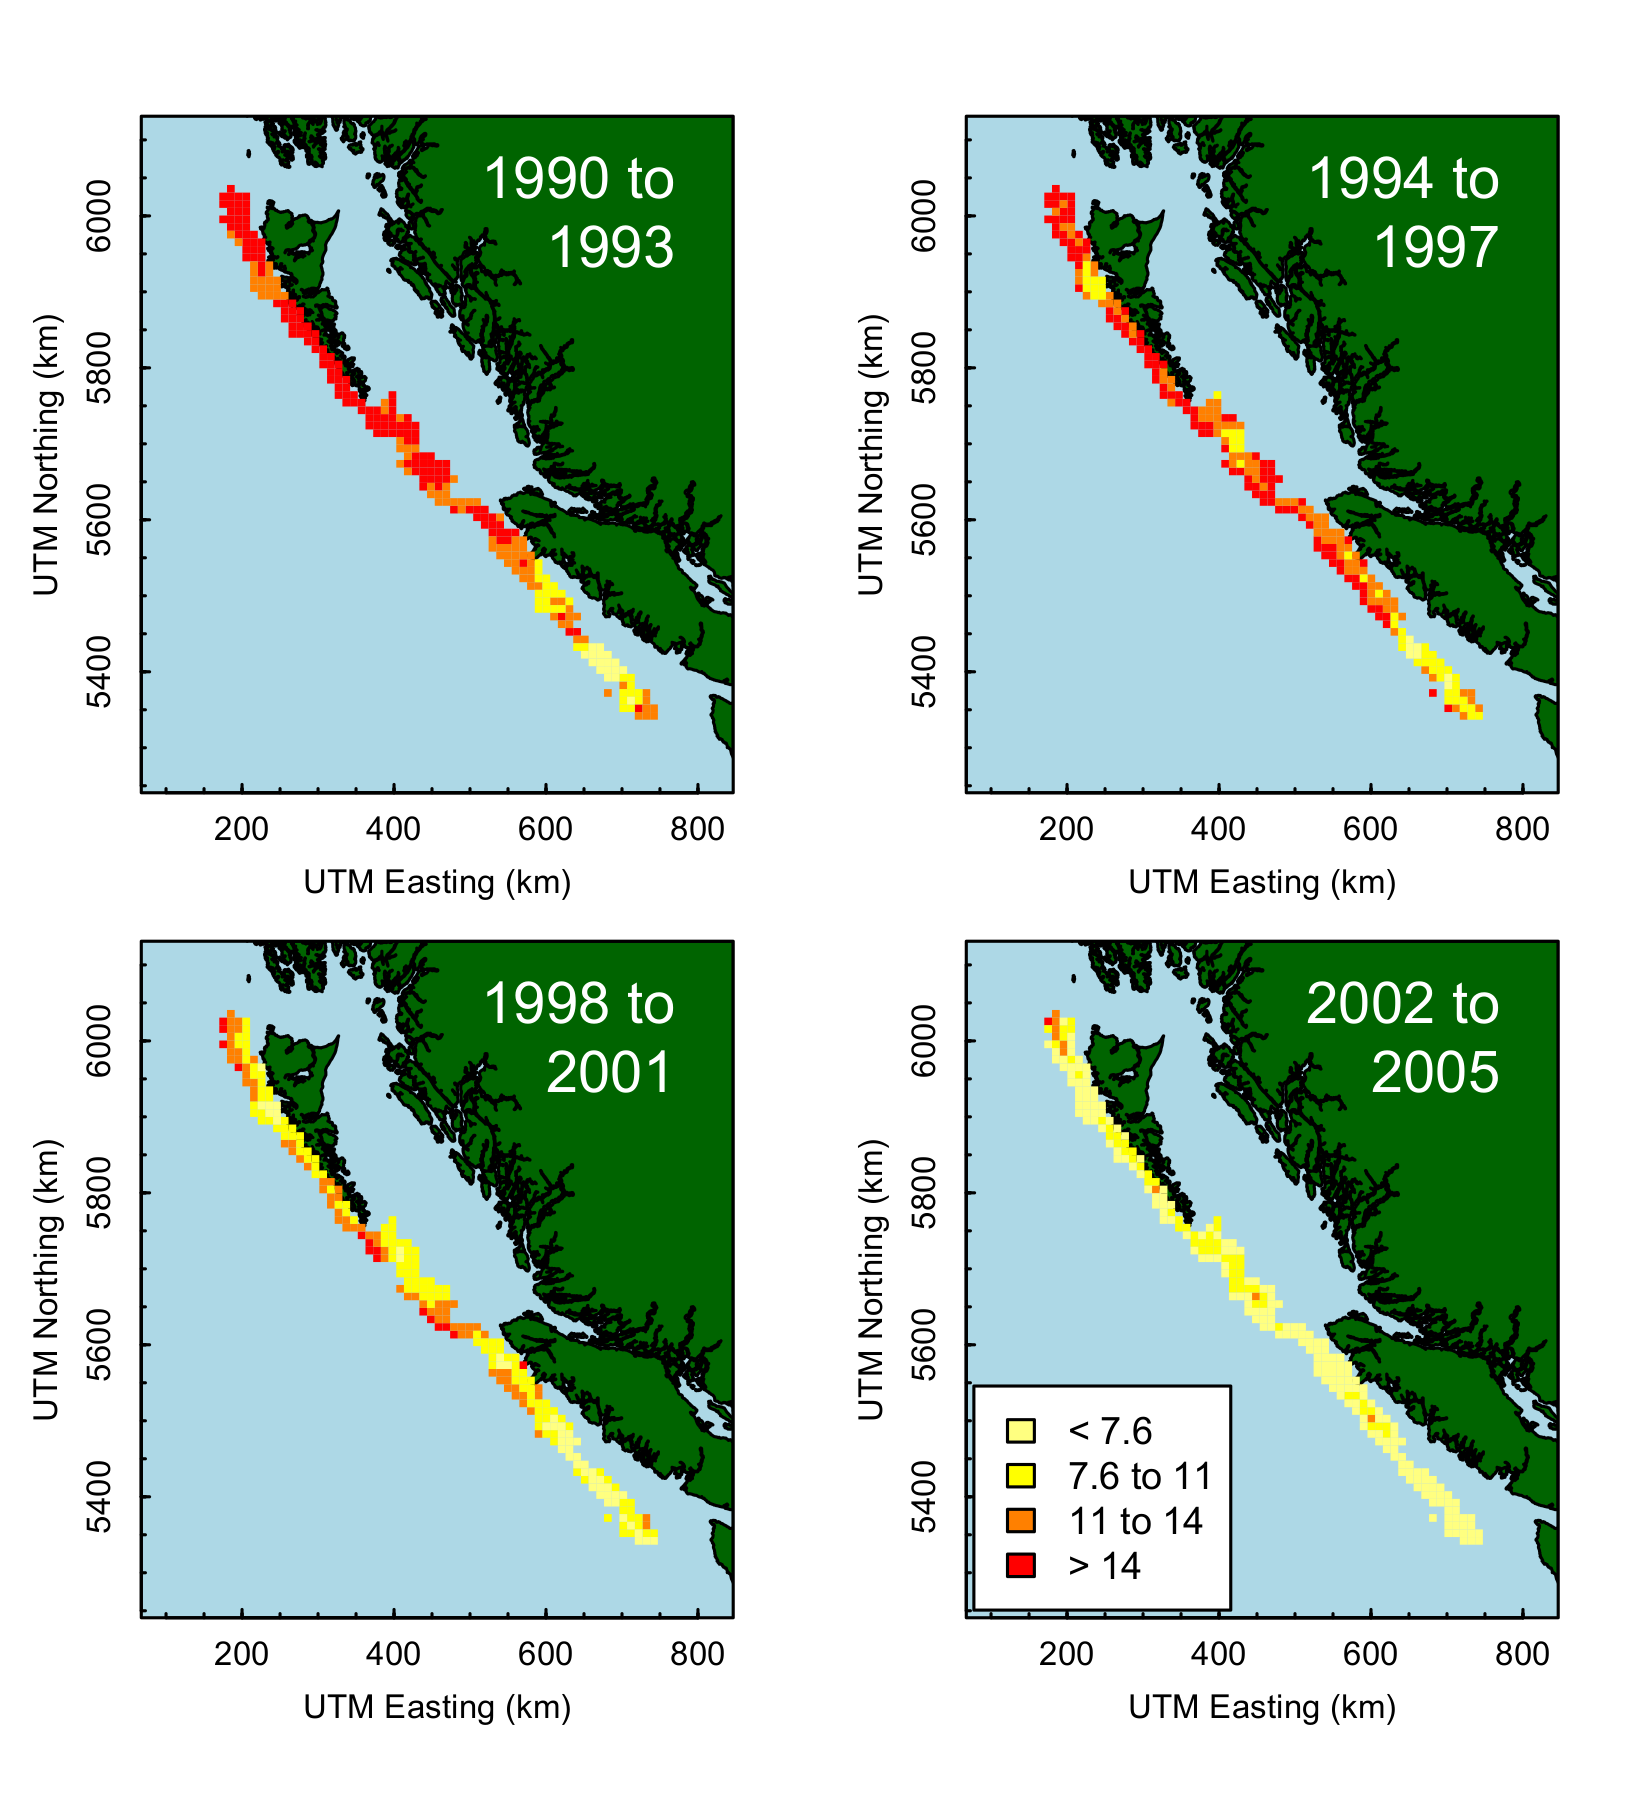 The maps above show the spatial mean CPUE inferred from catch
records. Units are in kilograms per trap. A reduction in CPUE is evident.
Averaging by fishing event does not show as much of a decline.
This difference can have implications when inferring the status and health
of the fish population and subsequent management actions.
The maps above show the spatial mean CPUE inferred from catch
records. Units are in kilograms per trap. A reduction in CPUE is evident.
Averaging by fishing event does not show as much of a decline.
This difference can have implications when inferring the status and health
of the fish population and subsequent management actions.
Other results from this project are described in my Master's thesis, available here: Read more »
Simulation of Fraser River Sockeye
Fraser River sockeye salmon are caught in fisheries as they migrate from the open ocean to their spawning grounds in the upper reaches of the Fraser River watershed in British Columbia. This superpopulation is comprised of genetically distinct subpopulations that migrate with overlapping timing. There are fisheries bound by international international agreement that occur in saltwater as well as domestic inshore fisheries. As the fish get closer to their spawning grounds, they pass through freshwater aboriginal fisheries that have priority despite relying on fish escaping other fisheries earlier in their migration. This makes for a very complicated system to manage.
To help with the management of these fisheries, I developed a simulation framework called FSmod for the R statistical computing environment. The idea is to enable managers and stakeholders to simulate different management strategies under different environmental scenarios. The FSmod framework simulates directional migration of co-migrating populations (e.g. Fraser Sockeye salmon populations) in the presence of varying environmental conditions. Effects on the movement and survival of the populations as they migrate can be both acute and cumulative thanks to the use of BOTS (BOTS are Objects for Tracking States). The model can be configured to be stochastic or deterministic. It employs discrete timesteps and spatial increments that can be arbitrarily large or small (within computing limits). The framework is driven in large part by a series of configuration files that are read in at run-time and define the characteristics of the system. Due to the computational requirements typical of such large problems, the package can make use of a computing cluster, which greatly speeds computation.
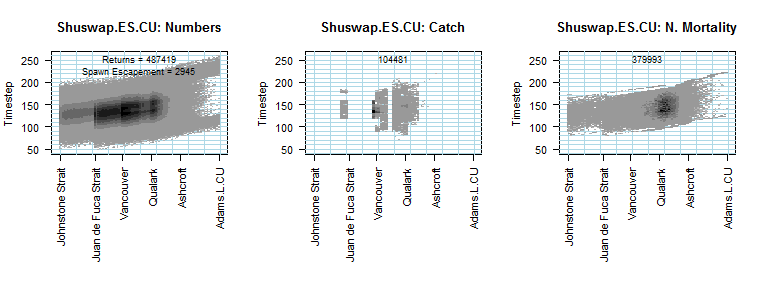 Above: The simulation output shows the location of each population at each point in time,
as well as catch and natural mortality (which was particularly bad for this stock
in this simulation scenario).
Above: The simulation output shows the location of each population at each point in time,
as well as catch and natural mortality (which was particularly bad for this stock
in this simulation scenario).
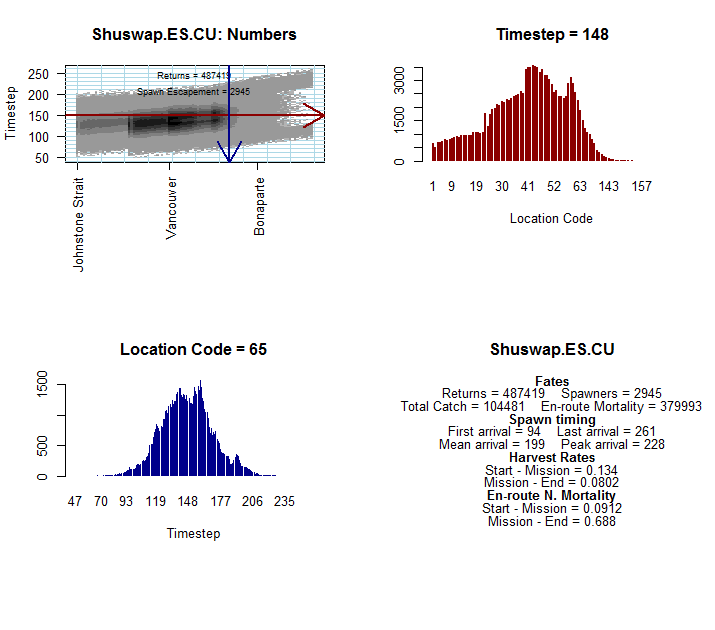
Below: There are also interactive graphics options allowing for conditional
distribution profiles. Here we chose to visualize the distribution
of the early summer Shuswap population at timestep 148 and location code 65.
If you are interested in learning more about this simulation framework, please let me know. Cameron Noble used FSmod in his Master's thesis work at SFU-REM: Cam Noble's thesis »